20 Review
Final Exam
The final exam will be an oral interview of one of the projects you have developed during the semester. You my pick from one of the following:
- GSE/DEG App
- Metadata Lookup App
- Non-B Refactorization
Please schedule a time between May 4th and May 7th to meet for your exam (either in person or via Zoom using this link: https://hood.campus.eab.com/pal/dkT4mB31MS ) and let me know which project you would like to use for the exam.
Here is a list of prompts and questions for the exam:
Give me a 3 minute overview of your project.
Logic and technical details
- Pick a complex function or block of code in your project. Please walk me through the execution flow from input to output. How does this function fit into the project?
- Pick a package used in your project. What specific problem did it solve for you, and how is it incorporated into your code?
Testing and error handling
- Tell me about a bug or issue you encountered during the development of this project. How were you able to overcome it?
- Show me a place in the code where bad input from a user is handled which might have otherwise broken the code. What does the code do to gracefully handle this scenario?
- What is the most fragile part of the code? If it were to fail, what is the most likely cause? Show me a test that checks for the code’s behavior under this scenario.
Lessons learned
- Looking back, what would you change about your project if you were to do it over again?
- What was the most difficult part of the project to implement?
- If you had two more weeks to work in this, what would you add?
Review
Version Control
- Git workflow
- git init / git pull
- Stage / add files
- Commit
- Push
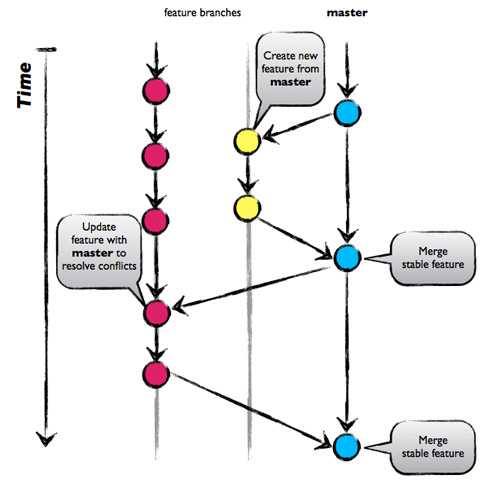
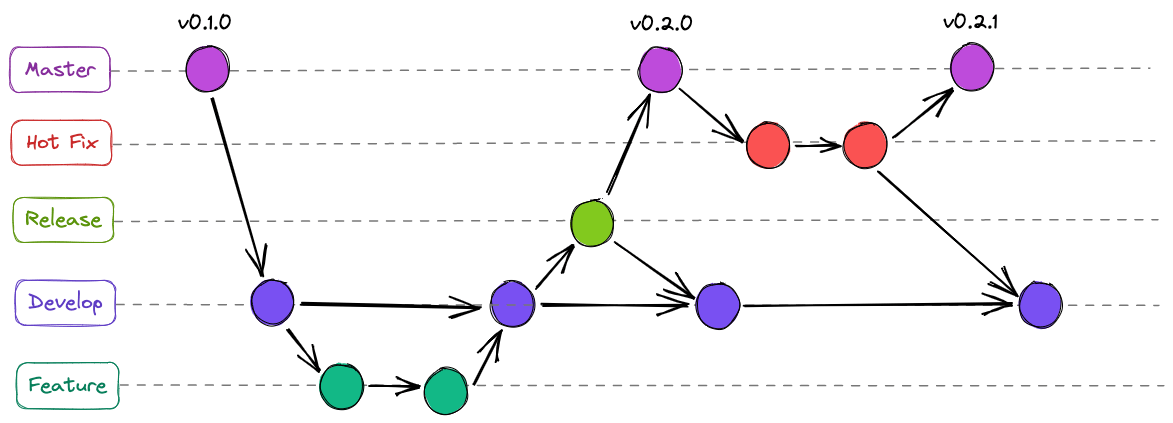
Git Branching Strategies
- Most basic approach
- Everything is done on the main branch

Components of a Good Repository
README.md(andREADME.qmdto update with code)CONTRIBUTING.mdLICENSECANGELOG.md
Additional GitHub Tools

Pull requests (PRs)
For more than contributing to open source projects
Manage branches
Code Reviews
Releases/Pacakges
A GitHub Release is a wrapper around a Git Tag
It allows you to attach compiled binaries or release notes
GitHub Packages can act as a private registry (e.g. to use with
npm)
- Automation with GitHub Actions
- Help manage CI/CD actions
- Create and manage in ‘Actions’ tab
- Push, PR, etc… can trigger jobs that run on multiple runners
Shiny
ui: the front end (what the user sees)server: the back-end containing logic
UI Inputs
Each input typically has
inputID: internal name, must be unique and follow R variable naming conventionslabel: visible text
Different types of inputs:
Free Text:
textInput(),textAreaInput()Numbers:
numericInput(),sliderInput().Choices:
selectInput(),radioButtons(),checkboxGroupInput().
UI Outputs
Outputs are placeholders in the UI
Every
Output()in the UI must have a correspondingrender()in the server.textOutput()→renderText()tableOutput()→renderTable()plotOutput()→renderPlot()
Ractivity
- Reactivity is what makes Shiny apps dynamic and interactive
- Imperative (Normal R): “Take X, do Y, save as Z”
- Declarative (Shiny): “This is the recipe for Z. Update it whenever the ingredients change.”
- For example, when
output$ydepends oninput$x:output$y <- renderText({ paste("You selected", input$x) })When
input$xchanges,output$ywill be updated
Reactive Expressions
- To avoid duplicated code or minimize expensive calculations
server <- function(input, output, session) {
  x1 <- reactive(rnorm(input$n1, input$mean1, input$sd1))
  x2 <- reactive(rnorm(input$n2, input$mean2, input$sd2))

  output$hist <- renderPlot({
    freqpoly(x1(), x2(), binwidth = input$binwidth, xlim = input$range)
  }, res = 96)

  output$ttest <- renderText({
    t_test(x1(), x2())
  })
}
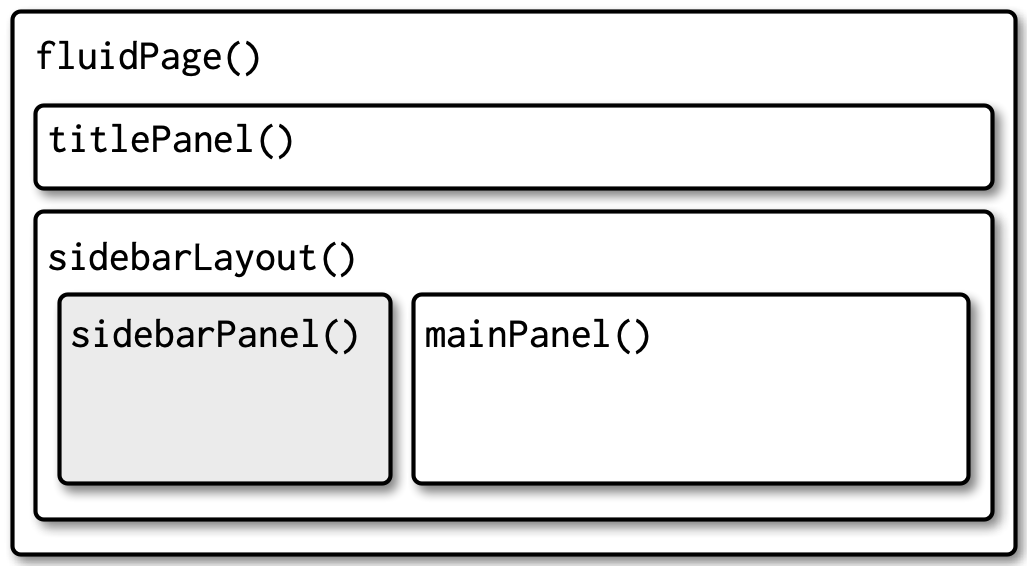
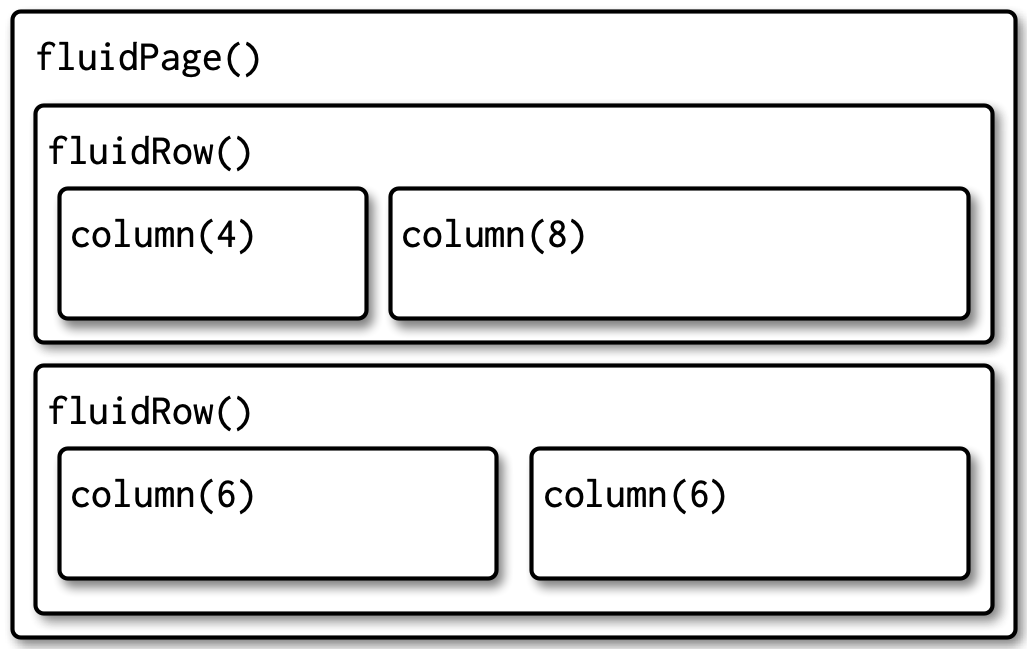
Layouts
Multi-Page Layouts
tabsetPanel(): Create a tabbed interface (withinfluidPage())tabPanel(): Define individual tabs within the panelTabs are displayed horizontally at the top of the page
ui <- fluidPage(
  titlePanel("Tabbed Interface"),
  tabsetPanel(
    tabPanel("Uniform", plotOutput("plot1")),
    tabPanel("Normal", plotOutput("plot2"))
  )
)navlistPanel(): Create a navigation list on the left side of the page (withinfluidPage())tabPanel(): Define individual tabs within the navlistTabs are displayed vertically on the left side of the page
ui <- fluidPage(
  titlePanel("Discrete and Continuous Distributions"),
  navlistPanel(id = "tabset",
    "Discrete",
    tabPanel("Binomial", plotOutput("plot_bin")),
    "Continuous",
    tabPanel("Normal", plotOutput("plot_norm")),
    tabPanel("Uniform", plotOutput("plot_unif"))
  )
)navbarPage(): Create a navigation bar at the top of the page (replacesfluidPage())tabPanel(): Define individual pages within the navbarnavbarMenu(): Create a dropdown menu within the navbar for additional pagesTabs are displayed horizontally at the top of the page, with dropdowns for tab menus
ui <- navbarPage(
  "Discrete and Continuous Distributions",
  navbarMenu("Discrete",
    tabPanel("Binomial", plotOutput("plot_bin")),
    tabPanel("Poisson", plotOutput("plot_pois"))
  ),
  navbarMenu("Continuous",
    tabPanel("Normal", plotOutput("plot_norm")),
    tabPanel("Uniform", plotOutput("plot_unif"))
  )
)
Themes
- Add
theme = bslib::bs_theme(...)to yourfluidPage()to apply a pre-built theme - Calling
thematic::thematic_shiny()in your server function will automatically apply the current theme to your plots
Interactive reporting with Shiny
- Add
server: shinyto your yaml header (requires a server)
Streamlit
Top-to-bottom execution
UI and backend are blended into a single, linear script
When a user adjusts a widget (e.g. changes a p-value slider), the script re-runs with the new variable value
To prevent reloading big datasets on every click, Streamlit uses caching mechanisms
Text Elements
st.title("🧬 Variant Filtering Pipeline")
st.header("Step 1: Quality Control")
st.write("This pipeline accepts VCF files and filters based on user-defined criteria.")
st.markdown(
    """
    We can include a large, static block of markdown formatted text here. See these [Streamlit](https://docs.streamlit.io/) and [Markdown](https://www.markdownguide.org/) documentation pages for more information.

    **Note:** Ensure your VCF is compressed (`.vcf.gz`).
    """)
Displaying Data
st.subheader("Sample Metadata")

# Create a mock dataframe for demonstration
data = {
    'Sample_ID': ['SRR123', 'SRR124', 'SRR125'],
    'Condition': ['Wildtype', 'Knockout', 'Knockout'],
    'Read_Count': [1500000, 1200000, 1800000]
}
df = pd.DataFrame(data)

st.write("### Display with `st.dataframe:`")
st.dataframe(df)

st.write("### Display with `st.write:`")
st.write(df)
Interactivity
st.subheader("Filter Parameters")

# Text Input for sequences
motif = st.text_input("Enter binding motif:", "ATGC")

# Slider for thresholds
p_value = st.slider("Select Max P-Value:", min_value=0.01, max_value=0.10, value=0.05, step=0.01)

# File Uploader
uploaded_file = st.file_uploader("Upload FASTA file", type=["fasta", "fa"])

st.write(f"Filtering for motif **{motif}** with p-value < **{p_value}**.")Loading & Caching
st.subheader("Data Loading & Caching")

@st.cache_data
def load_massive_dataset():
    # Simulating a slow data load (e.g., parsing a large TSV)
    time.sleep(3)
    return pd.DataFrame({"Gene": ["BRCA1", "TP53", "EGFR"], "Expression": [12.5, 8.2, 15.1]})

# This will take 3 seconds the first time, and 0 seconds on reruns
df = load_massive_dataset()
st.dataframe(df)Relational Databases
- Think of this as an Excel with multiple sheets (i.e. tables)
- Each table is tidy (one row per observation, one column for each variable)
- If a variable is not tidy (i.e. observations split over multiple rows / data is duplicated over rows), create a new table
- Each row has a primary key that uniquely identifies the observation
- Observations are linked to other tables via foreign keys that point to primary keys in the other table
Normalization of Databases
- Normalization in the context of databases:
- Make all tables tidy
- Avoid data duplication and inconsistencies
- Rule of thumb: If you find yourself typing the exact same text over and over in a column (like “Asia” or “Europe”), it probably deserves its own table
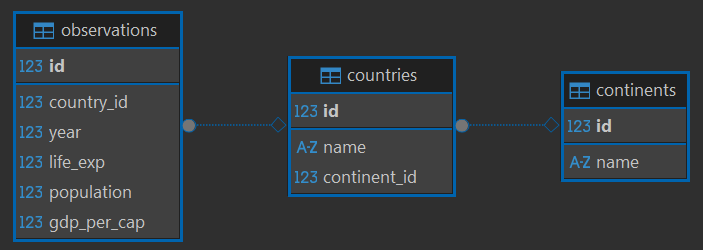
CRUD SQL Operations
CREATE TABLE coalitions (id INTEGER PRIMARY KEY, name TEXT);
CREATE TABLE coalitions_contries (id INTEGER PRIMARY KEY,
                                  FOREIGN KEY (coalition_id) REFERENCES coalitions (id),
                                  FOREIGN KEY (country_id) REFERENCES countries (id));
INSERT INTO countries (name, continent_id)
VALUES ('Atlantis', 2); -- 2 is Europe's ID SELECT countries.name, observations.year, observations.gdp_per_cap
FROM observations
INNER JOIN countries ON observations.country_id = countries.id
WHERE countries.id = 72
ORDER BY observations.gdp_per_cap DESC
LIMIT 5UPDATE countries
SET name = "New Atlantis"
WHERE name = "Atlantis"DELETE FROM countries
WHERE name = 'New Atlantis'Working with APIs
- Each API has documentation for calling it (e.g. see the NCBI eUtils documentation)
- We can use the Python
requestspackage to submit API calls
search_url = "https://eutils.ncbi.nlm.nih.gov/entrez/eutils/esearch.fcgi"
search_params = {
    "db": "nucleotide",
    "term": "BRCA1[Gene] AND human[Organism] AND refseq[Filter]",
    "retmode": "json" # Force JSON instead of the default XML
}

response = requests.get(search_url, params=search_params)
response.raise_for_status()
search_data = response.json()
Collaborating with AI Agents
- Plan-Act-Observe-Refine (PAOR) loop
- Use git
- Plan before you code
- Use context - be specific
- Maintain accountability!