library(shiny)

ui <- fluidPage(
  selectInput("chrom", "Select Chromosome:", choices = c("Xp22.33", "Xp22.32", "Xp22.31", ...)),
  selectInput("gene", "Select Gene:", choices = NULL) # Starts empty
)

server <- function(input, output, session) {

  # The Observer: It watches 'input$chrom' and triggers a side effect
  observeEvent(input$chrom, {
    # 1. Logic to determine new choices (usually based on a dataframe)
    new_choices <- get_genes_for_chrom(input$chrom)

    # 2. The Side Effect: Changing the UI state without 'returning' a value
    updateSelectInput(session, "gene", choices = new_choices)
  })
}12 Advanced Shiny
Acknowledgements
Today’s material comes largely from Layouts, themes, HTML. Gemini Code Assist was also active during the development of these materials, and some text was generated with its assistance.
Review
Before we dive into the new material, let’s review what we covered previously.
ui: The front-end (what the user sees)server: The back-end (the R logic)- Reactivity
- Layouts
UI IO
*Input: User inputs (e.g. text, sliders, select)*Output/render*: Outputs generated by the server (e.g. text, plot, table)
Server
- Use
inputto access user inputs - Use
outputto access outputs for the UI - Render outputs using
render*functions (e.g.renderText,renderPlot)
Reactivity
- Reactive expressions: Variables that automatically update when their inputs change
- Use
reactive()to create them - Access them like regular functions (e.g.
my_reactive())
- Use
Observers
- Observers: Functions that run when their inputs change, but don’t return a value
- Use
observeEvent()to create them - Useful for side effects (e.g. updating UI elements, printing to console)
- Use
For example, suppose we want to display only a shorter list of genes based on the chromosomal region selected by the user (i.e. rather than every gene in the genome).
Single-page Layouts
fluidPage(): A fluid layout that adjusts to the size of the browser windowtitlePanel(): Add a title at the topsidebarLayout(): A layout with a sidebar and main areasidebarPanel(): The sidebar area for inputsmainPanel(): The main area for outputs
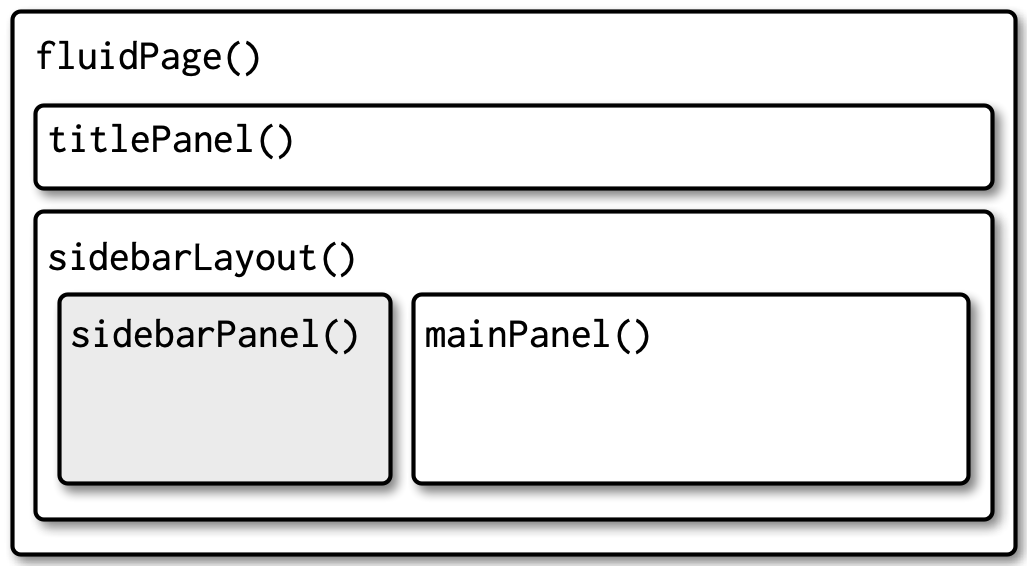
Example: Central Limit Theorem
ui <- fluidPage(
  titlePanel("Central limit theorem"),
  sidebarLayout(
    sidebarPanel(
      numericInput("m", "Number of samples:", 2, min = 1, max = 100)
    ),
    mainPanel(
      plotOutput("hist")
    )
  )
)
server <- function(input, output, session) {
  output$hist <- renderPlot({
    means <- replicate(1e4, mean(runif(input$m)))
    hist(means, breaks = 20)
  }, res = 96)
}
Multi-row Layouts
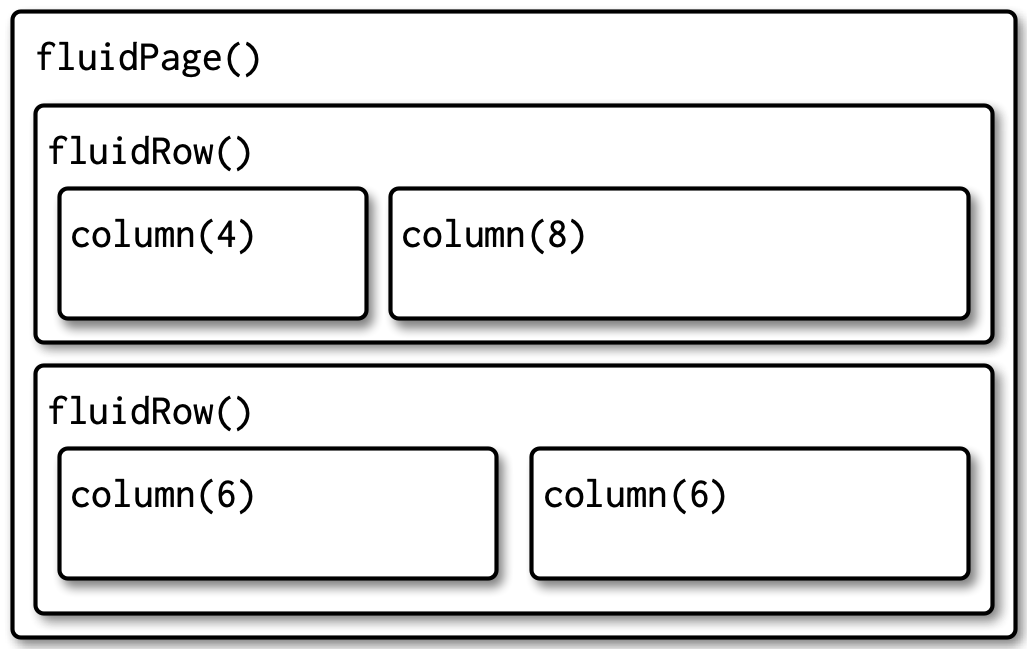
fluidRow(): Create a new row in the layoutcolumn(): Define columns within a row (total width is 12 columns)- Use multiple
fluidRow()andcolumn()calls to create complex layouts
Multi-page Layouts
tabsetPanel(): Create a tabbed interface (withinfluidPage())tabPanel(): Define individual tabs within the panel- Tabs are displayed horizontally at the top of the page
navlistPanel(): Create a navigation list on the left side of the page (withinfluidPage())tabPanel(): Define individual tabs within the navlist- Tabs are displayed vertically on the left side of the page
navbarPage(): Create a navigation bar at the top of the page (replacesfluidPage())tabPanel(): Define individual pages within the navbarnavbarMenu(): Create a dropdown menu within the navbar for additional pages- Tabs are displayed horizontally at the top of the page, with dropdowns for tab menus
tabsetPanel Example: Uniform/Normal Distributions
library(shiny)

ui <- fluidPage(
  titlePanel("Tabbed Interface"),
  tabsetPanel(
    tabPanel("Uniform", plotOutput("plot1")),
    tabPanel("Normal", plotOutput("plot2"))
  )
)

server <- function(input, output, session) {
  output$plot1 <- renderPlot({
    hist(runif(100))
  }, res = 96)

  output$plot2 <- renderPlot({
    hist(rnorm(100))
  }, res = 96)
}

shinyApp(ui, server)Themes
The bslib package allows you to customize the appearance of your Shiny app using Bootstrap themes. You can choose from pre-built themes or create your own.
- Add
theme = bs_theme(...)to yourfluidPage()to apply a pre-built theme
Shiny Themes
- Example: use
theme = bs_theme(bootswatch = "cosmo")to apply the “Cosmo” theme from Bootswatch
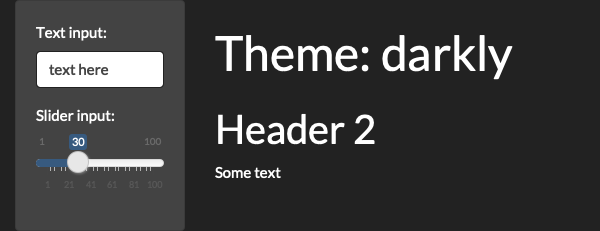
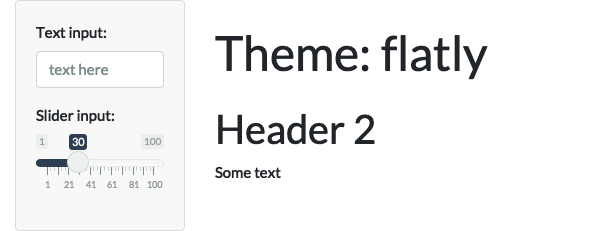
bslib themes from Wickham (2021)
Customization
You can also customize the theme, for example:
bslib::bs_theme(
  bg = "#0b3d91",
  fg = "white",
  base_font = "Source Sans Pro"
)
Tipbslib themes
- Browse Bootswatch themes on their website
- Try out bslib::bs_theme_preview() on your theme
Themed Plots
Calling thematic::thematic_shiny() in your server function will automatically apply the current theme to your plots.
library(shiny)
library(ggplot2)

ui <- fluidPage(
  theme = bslib::bs_theme(bootswatch = "darkly"),
  titlePanel("A themed plot"),
  plotOutput("plot"),
)

server <- function(input, output, session) {
  thematic::thematic_shiny()

  output$plot <- renderPlot({
    ggplot(mtcars, aes(wt, mpg)) +
      geom_point() +
      geom_smooth()
  }, res = 96)
}

shinyApp(ui, server)
Further Customization
- For more advanced customization, you can add custom HTML, CSS or JavaScript to your Shiny app
- Hadley Wickham has promised that there will be similar thematic customization options for Quarto documents in the future
Review Questions
- Provide an example of a “side effect” that would justify using an observer instead of a standard output.
- What does the function
fluidPage()do to ensure a Shiny app looks good on both a laptop and a large monitor?
- When using
fluidRow()andcolumn(), the maximum total width value that the columns in a single row add up to is 12. Why was the number 12 chosen instead of something larger or smaller?
- Why would a developer choose
navbarPage()instead offluidPage()when starting theiruidefinition?
- If you apply a dark theme using
bslib, why might you also need to callthematic::thematic_shiny()in the server function?
References
Wickham, Hadley. 2021. Mastering Shiny: Build Interactive Apps, Reports, and Dashboards Powered by R. First edition. Beijing Boston Farnham Sebastopol Tokyo: O’Reilly.